[](https://badge.fury.io/js/vue-chartjs)
[](https://codecov.io/gh/apertureless/vue-chartjs)
[](https://travis-ci.org/apertureless/vue-chartjs)
[](http://packagequality.com/#?package=vue-chartjs)
[](https://www.npmjs.com/package/vue-chartjs)
[](https://gitter.im/vue-chartjs/Lobby)
[](https://github.com/apertureless/vue-chartjs/blob/master/LICENSE.txt)
[](https://cdnjs.com/libraries/vue-chartjs)
# vue-chartjs
**vue-chartjs** is a wrapper for [Chart.js](https://github.com/chartjs/Chart.js) in vue. You can easily create reuseable chart components.
## Demo & Docs
- 📺 [Demo](http://demo.vue-chartjs.org/)
- 📖 [Docs](http://www.vue-chartjs.org/)
### Compatibility
- v1 later `@legacy`
- Vue.js 1.x
- v2 later
- Vue.js 2.x
After the final release of vue.js 2, you also get the v2 by default if you install vue-chartjs over npm.
No need for the @next tag anymore. If you want the v1 you need to define the version or use the legacy tag.
If you're looking for v1 check this [branch](https://github.com/apertureless/vue-chartjs/tree/release/1.x)
## Install
Simply run `yarn add vue-chartjs chart.js`
Or if you want to use it directly in the browser add
```html
```
to your scripts. See [Codepen](https://codepen.io/apertureless/pen/zEvvWM)
## Explanation of Different Builds
There are three different entry points. It depends on which build setup do you have. The dependencies are bundled or required as a peerDependency.
- Browser
- Browserify / Webpack 1
- Webpack 2
| Build | Chart.js |
|---|---|---|
| vue-chartjs.full.js | Bundled |
| vue-chartjs.full.min.js | Bundled |
| vue-chartjs.js | peerDependency |
| vue-chartjs.min.js | peerDependency |
| es/index* | peerDependency |
### Browser
You can use `vue-chartjs` directly in the browser without any build setup. Like in this [codepen](https://codepen.io/apertureless/pen/zEvvWM). For this case, please use the `vue-chartjs.full.min.js` which is the minified version. It has Chart.js bundled into it. And bundled to a UMD Module. So you only need that one file.
You can then simply register your component:
```js
Vue.component('line-chart', {
extends: VueChartJs.Line,
mounted () {
this.renderChart({
labels: ['January', 'February', 'March', 'April', 'May', 'June', 'July'],
datasets: [
{
label: 'Data One',
backgroundColor: '#f87979',
data: [40, 39, 10, 40, 39, 80, 40]
}
]
}, {responsive: true, maintainAspectRatio: false})
}
})
```
### Browserify / Webpack 1
If you're using Gulp, Browserify or Webpack 1 the entry is `vue-chartjs.js` which is __transpiled__ and __bundled__ UMD Module.
However Chart.js is a `peerDependencies` so you have to install it separately. In most projects This way, you can have different versions of Chart.js then in this package.
### Webpack 2
If you're using Webpack 2 it will automatically use the `jsnext:main` / `module` entry point. Which is `es/index.js`
It is a __transpiled__ es version of the source. And is not __bundled__ to a module. This way you three shaking will work. Like in the bundled version, `Chart.js` is a `peerDependencies` and need to be installed.
## How to use
You need to import the component and then either use `extends` or `mixins` and add it.
You can import the whole package or each module individual.
```javascript
import VueCharts from 'vue-chartjs'
import { Bar, Line } from 'vue-chartjs'
```
Just create your own component.
```javascript
// CommitChart.js
import { Bar } from 'vue-chartjs'
export default {
extends: Bar,
mounted () {
// Overwriting base render method with actual data.
this.renderChart({
labels: ['January', 'February', 'March', 'April', 'May', 'June', 'July', 'August', 'September', 'October', 'November', 'December'],
datasets: [
{
label: 'GitHub Commits',
backgroundColor: '#f87979',
data: [40, 20, 12, 39, 10, 40, 39, 80, 40, 20, 12, 11]
}
]
})
}
}
```
Then simply import and use your own extended component and use it like a normal vue component
```javascript
import CommitChart from 'path/to/component/CommitChart'
```
## Another Example with options
You can overwrite the default chart options. Just pass the options object as a second paramenter to the render method
```javascript
// MonthlyIncome.vue
import { Line } from 'vue-chartjs'
export default {
extends: Line,
props: ['data', 'options'],
mounted () {
this.renderChart(this.data, this.options)
}
}
```
Use it in your vue app
```javascript
import MonthlyIncome from 'path/to/component/MonthlyIncome'
```
## Reactivity
Chart.js does not update or re-render the chart if new data is passed.
However you can simply implement this on your own or use one of the two mixins which are included.
- `reactiveProp`
- `reactiveData`
Both are included in the `mixins` module.
The mixins automatically create `chartData` as a prop or data. And add a watcher. If data has changed, the chart will update.
However keep in mind the limitations of vue and javascript for mutations on arrays and objects. More info [here](http://vue-chartjs.org/#/home?id=reactive-data)
```javascript
// MonthlyIncome.js
import { Line, mixins } from 'vue-chartjs'
export default {
extends: Line,
mixins: [mixins.reactiveProp],
props: ['chartData', 'options'],
mounted () {
this.renderChart(this.chartData, this.options)
}
}
```
### Mixins module
The `mixins` module is included in the `VueCharts` module and as a seperate module.
Some ways to import them:
```javascript
// Load complete module with all charts
import VueCharts from 'vue-chartjs'
export default {
extends: VueCharts.Line,
mixins: [VueCharts.mixins.reactiveProp],
props: ['chartData', 'options'],
mounted () {
this.renderChart(this.chartData, this.options)
}
}
```
```javascript
// Load speperate modules
import { Line, mixins } from 'vue-chartjs'
export default {
extends: Line,
mixins: [mixins.reactiveProp],
props: ['chartData', 'options'],
mounted () {
this.renderChart(this.chartData, this.options)
}
}
```
```javascript
// Load speperate modules with destructure assign
import { Line, mixins } from 'vue-chartjs'
const { reactiveProp } = mixins
export default {
extends: Line,
mixins: [reactiveProp],
props: ['chartData', 'options'],
mounted () {
this.renderChart(this.chartData, this.options)
}
}
```
## Available Charts
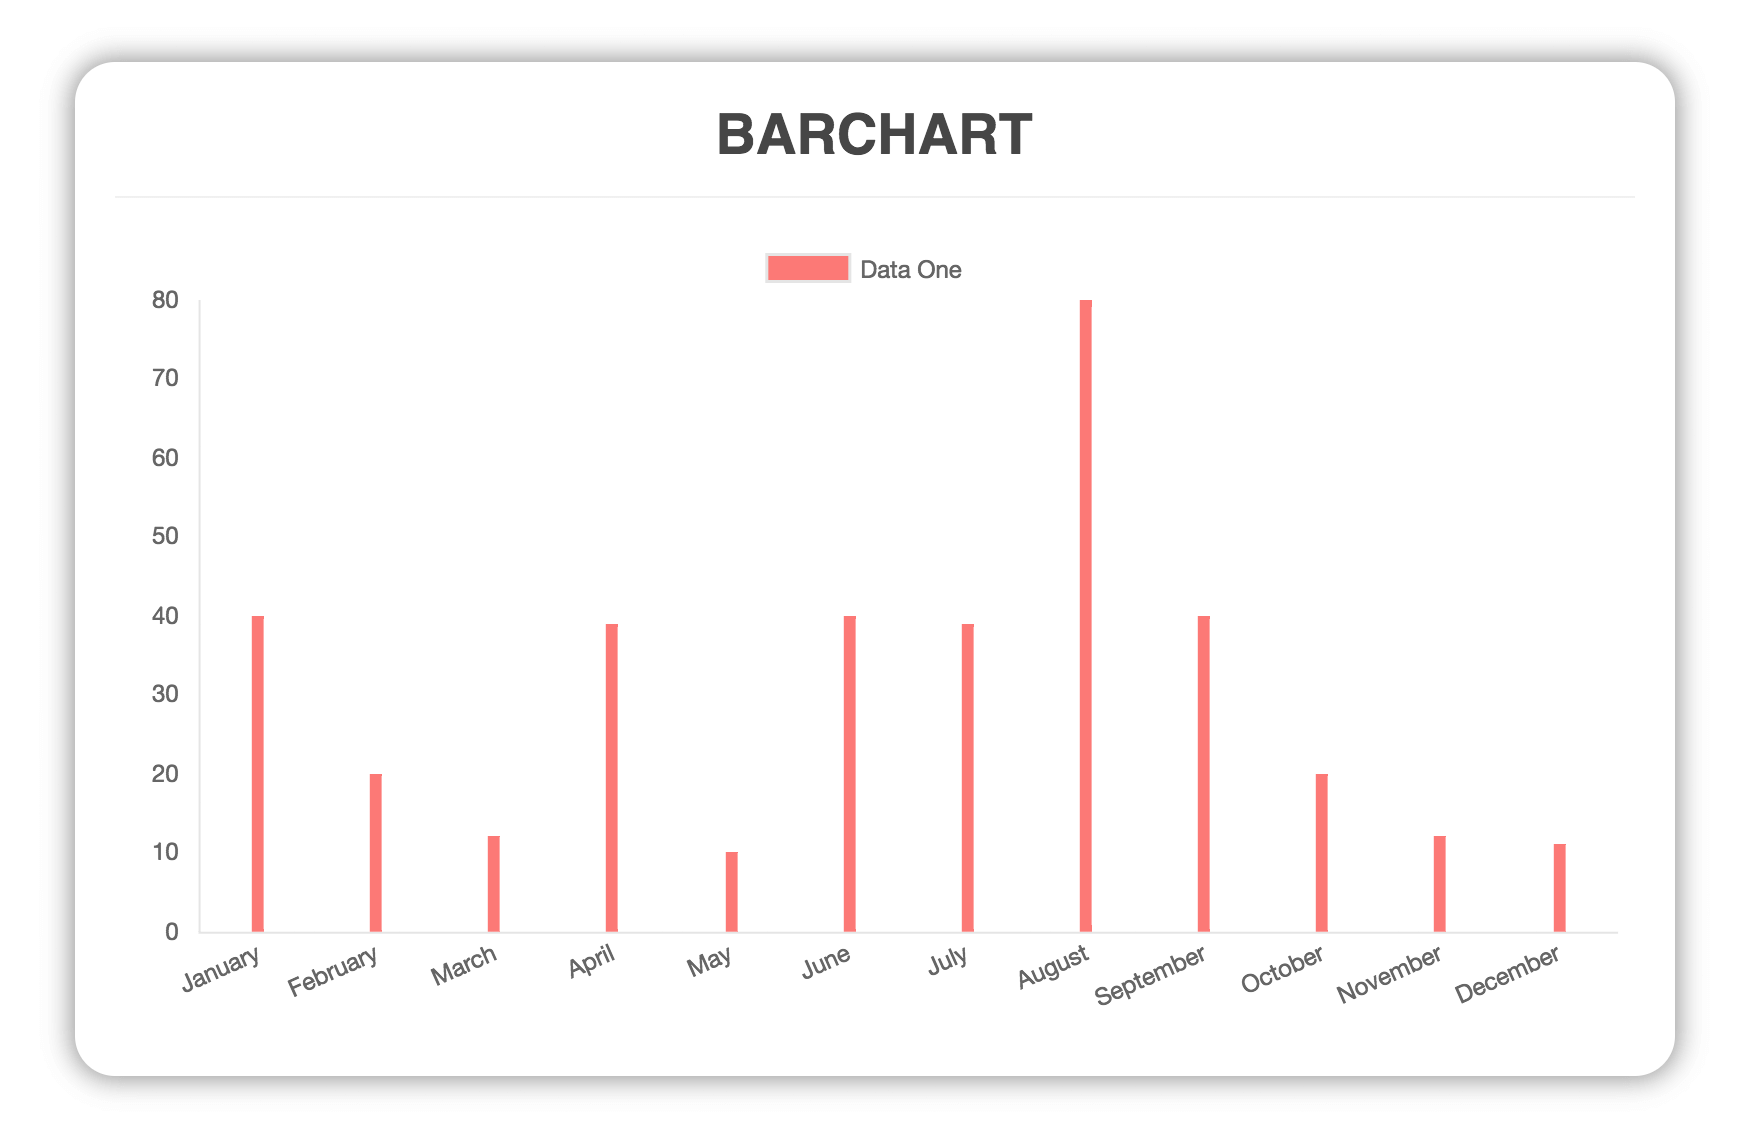
### Bar Chart
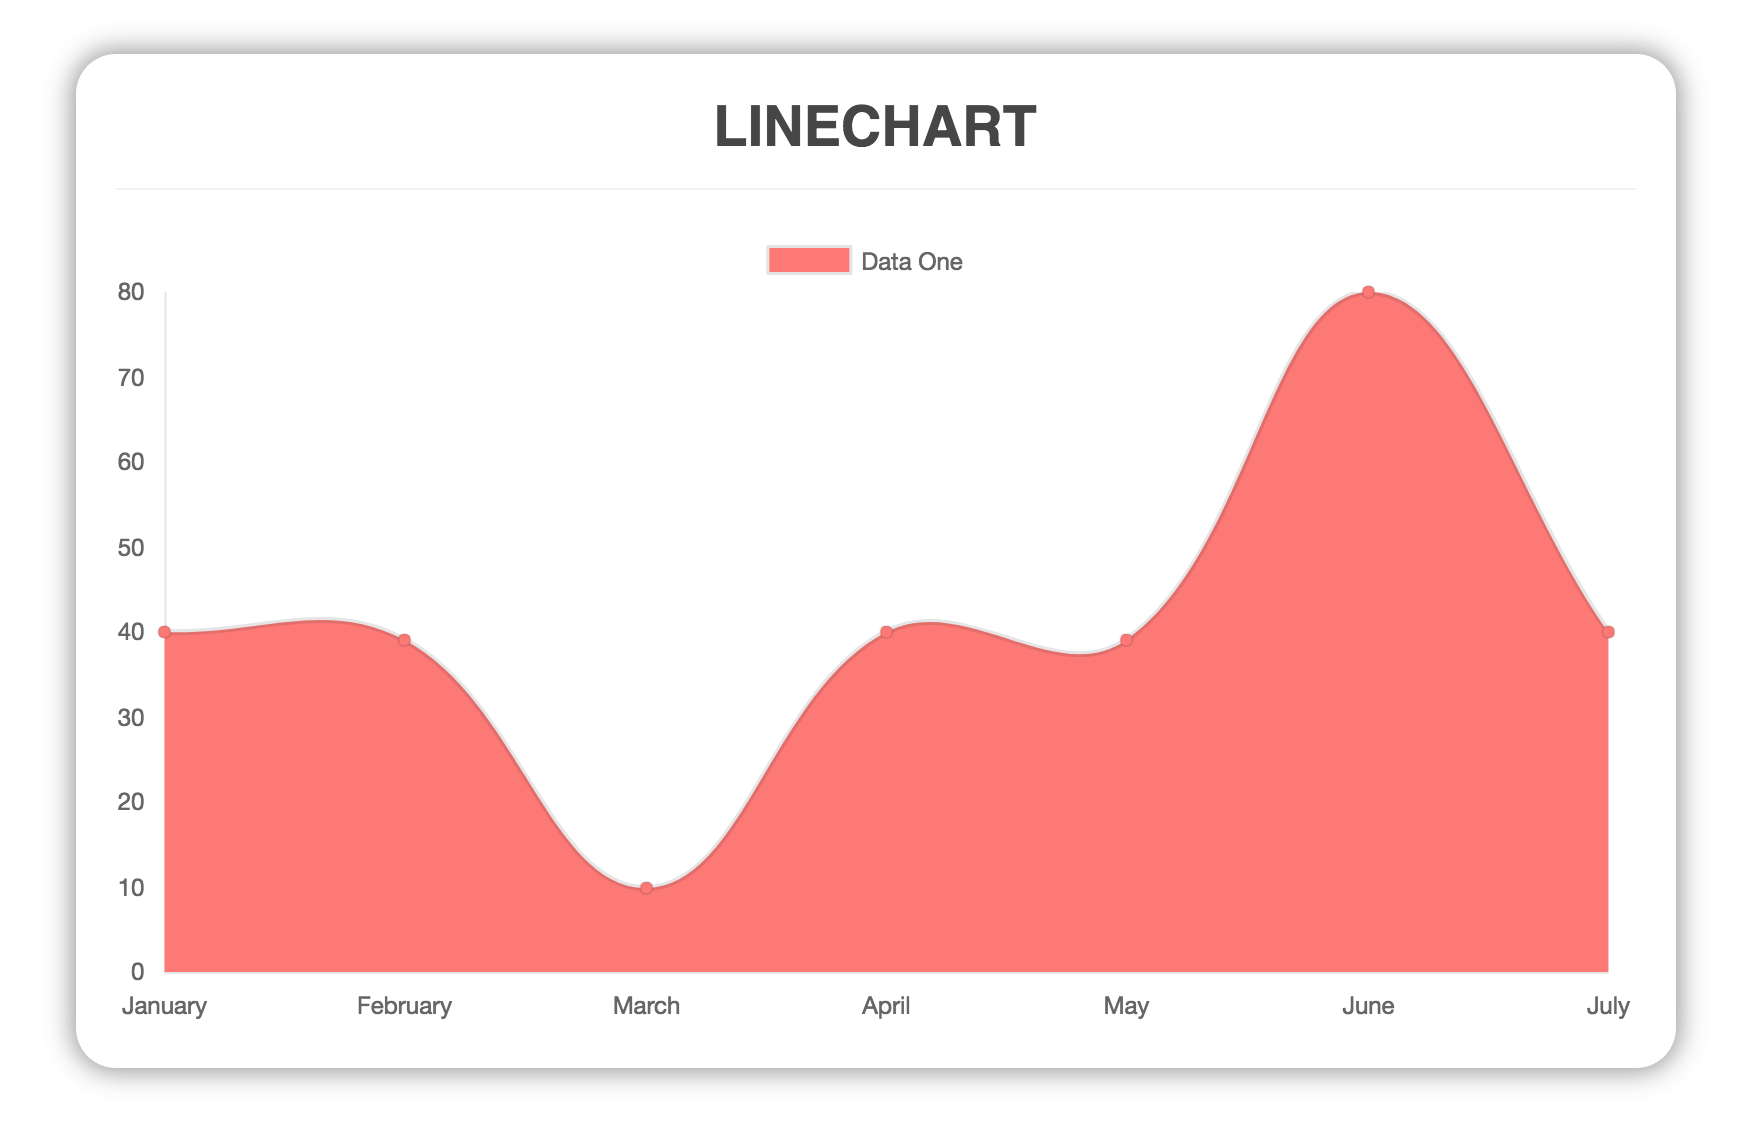
### Line Chart
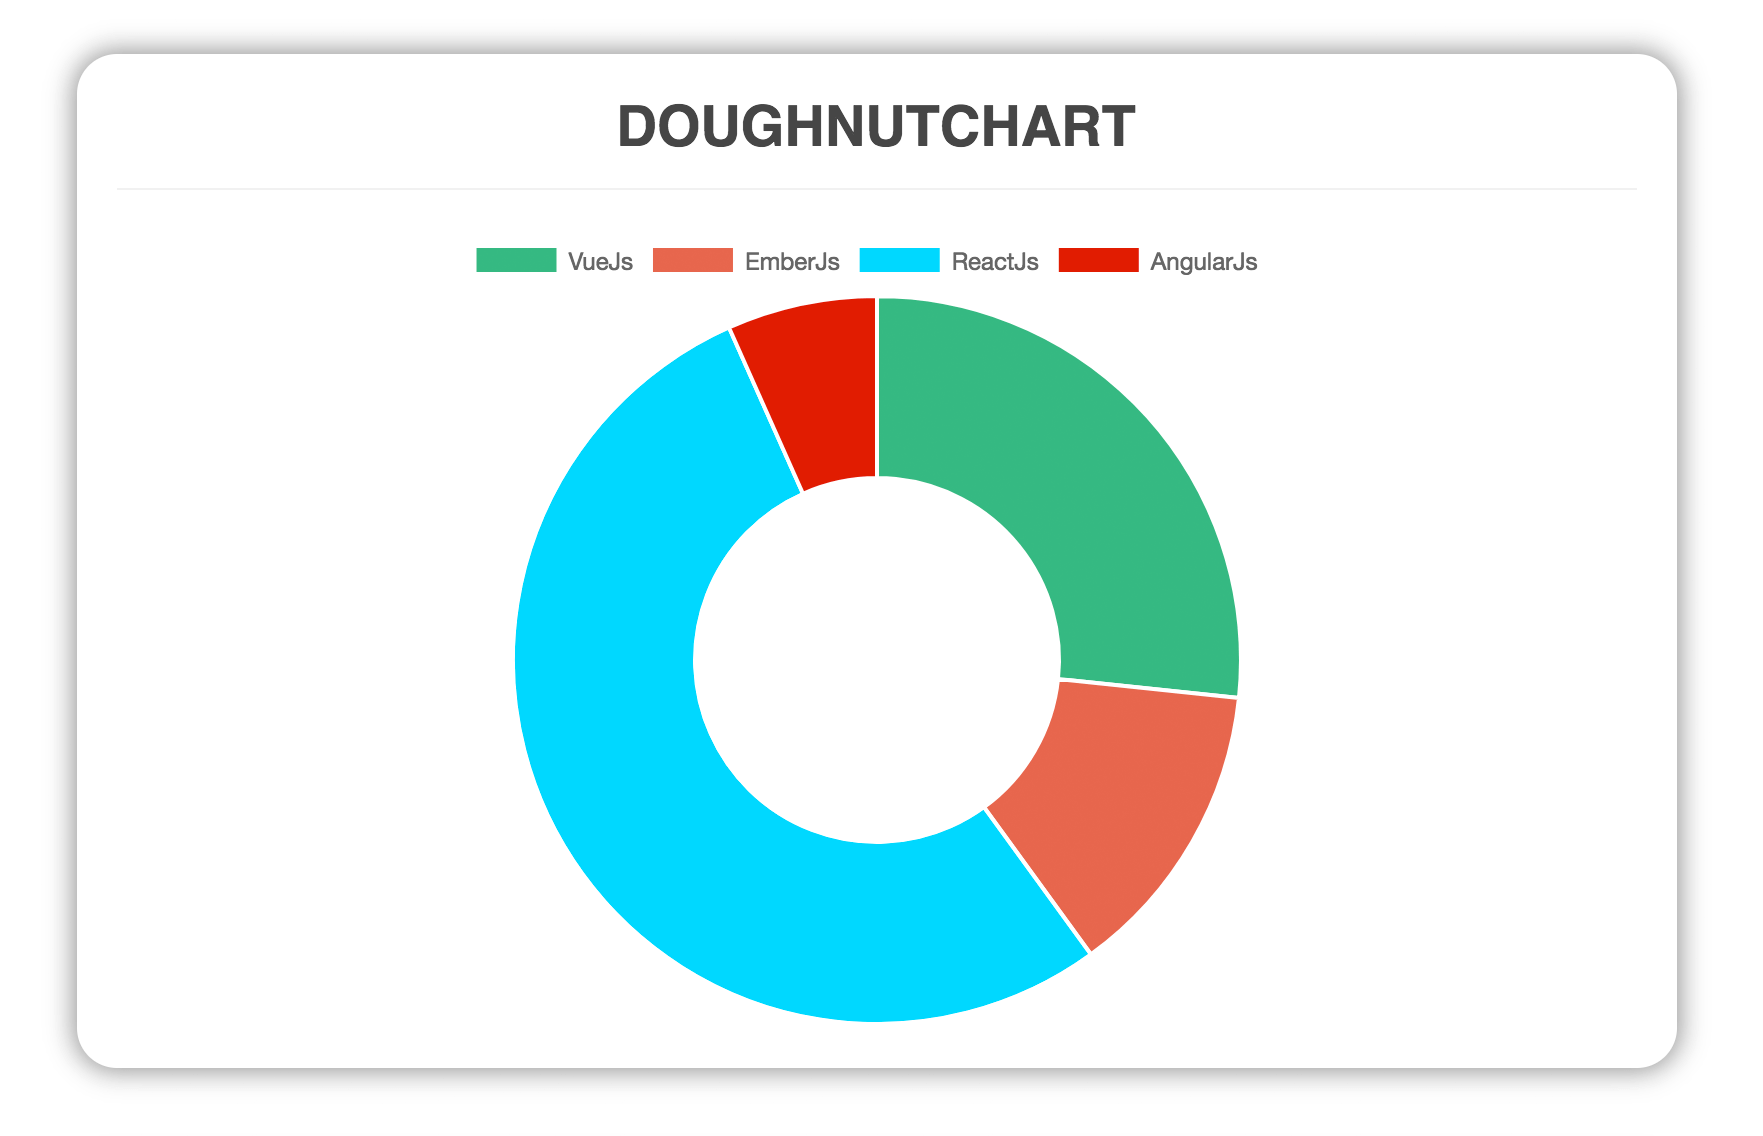
### Doughnut
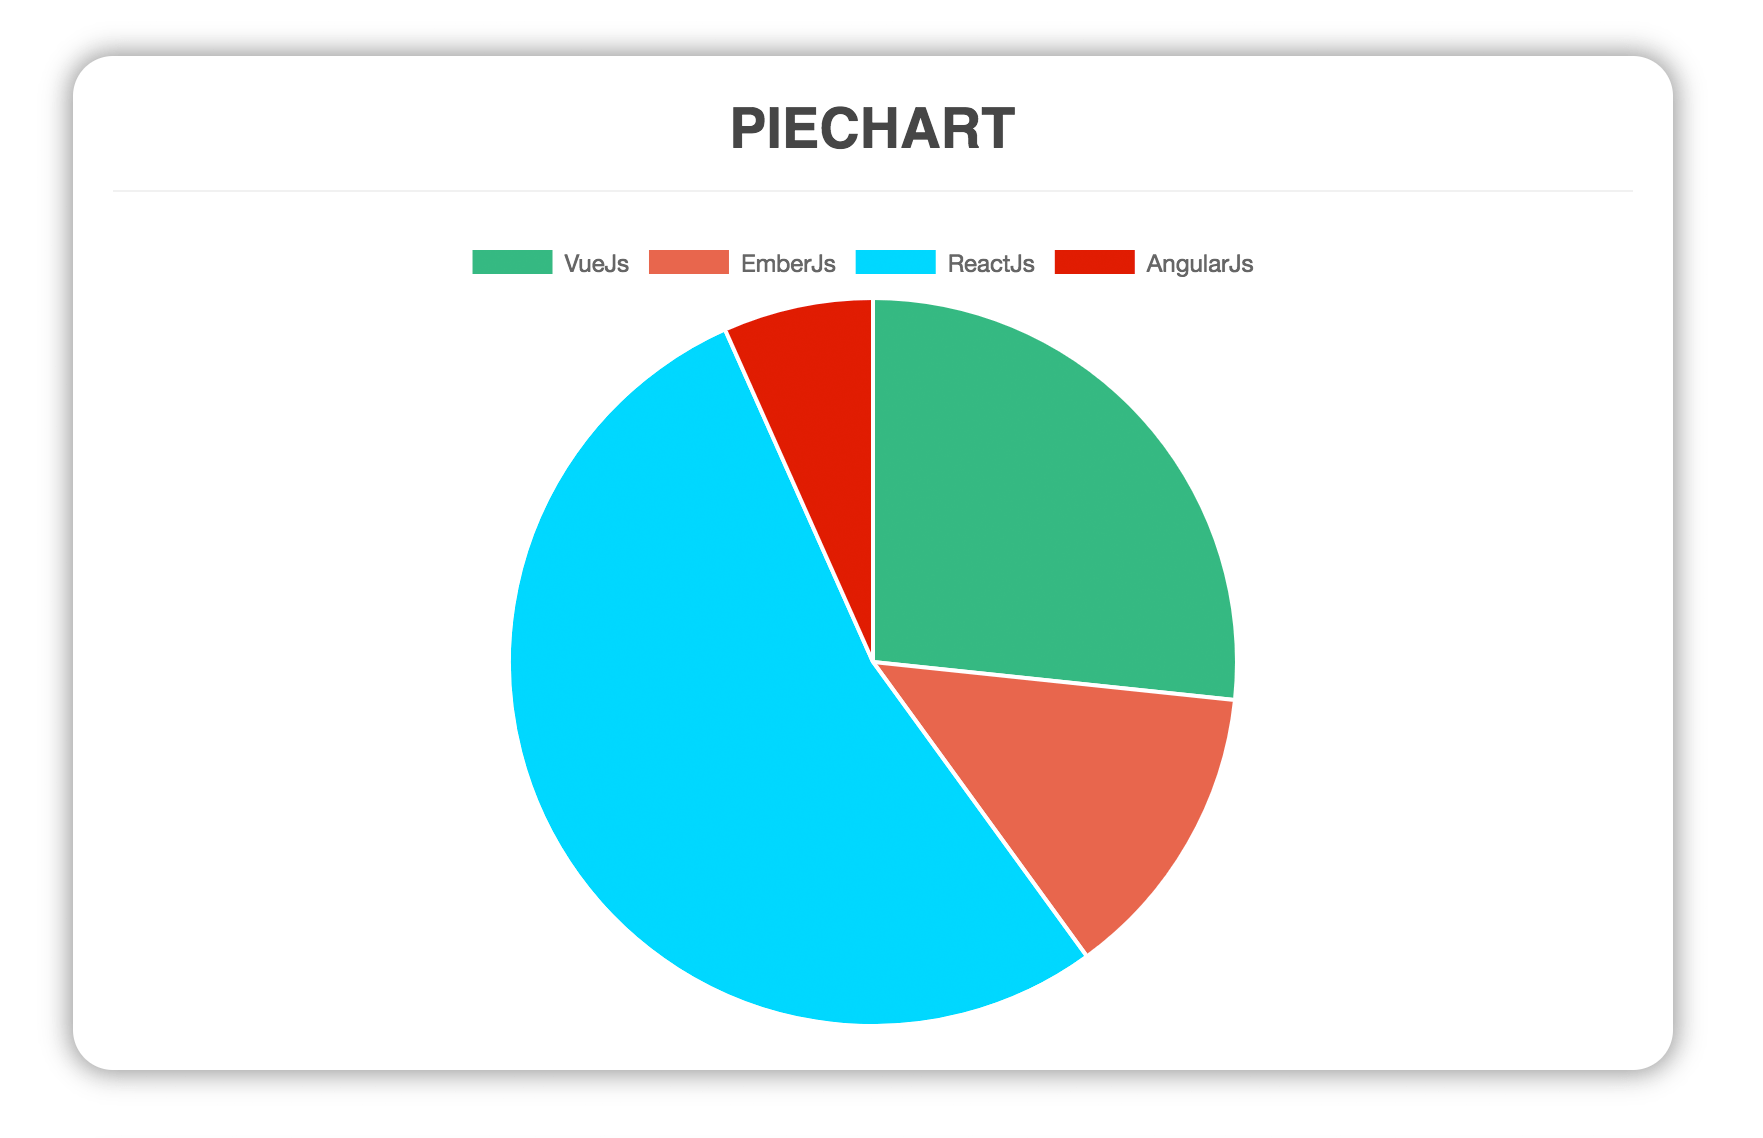
### Pie
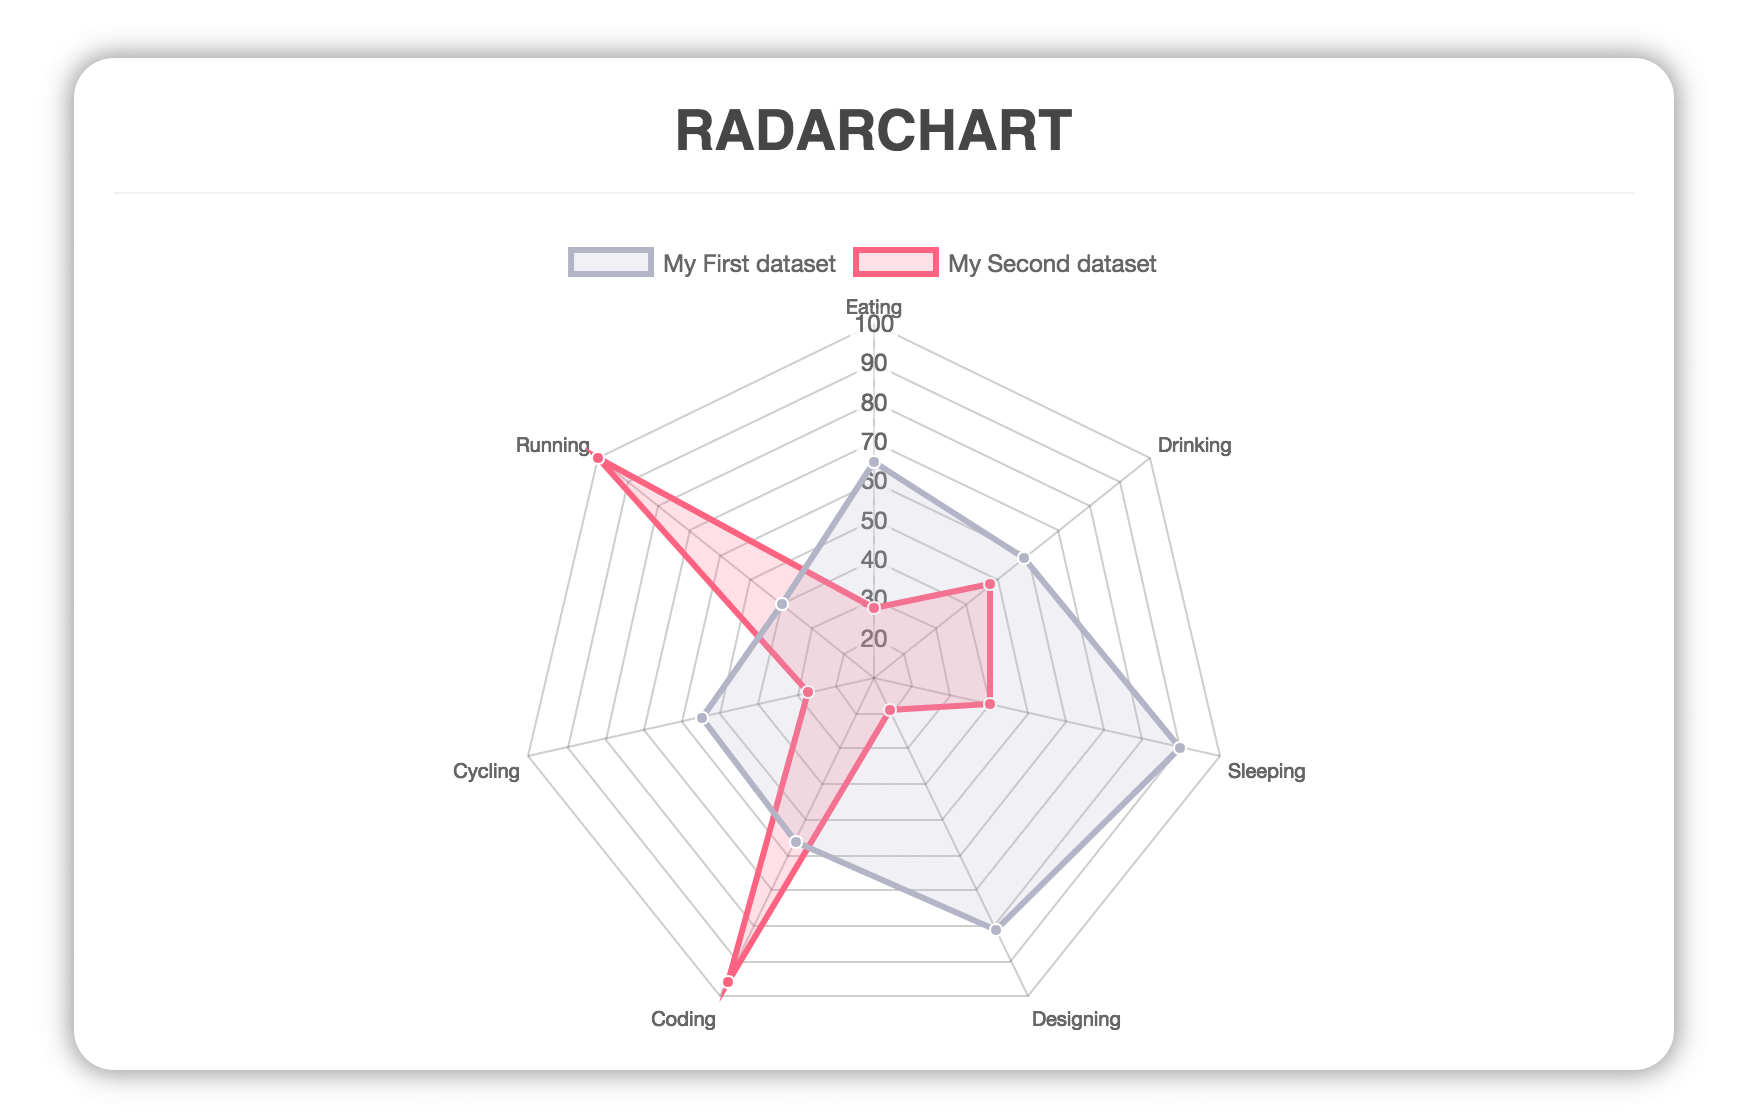
### Radar
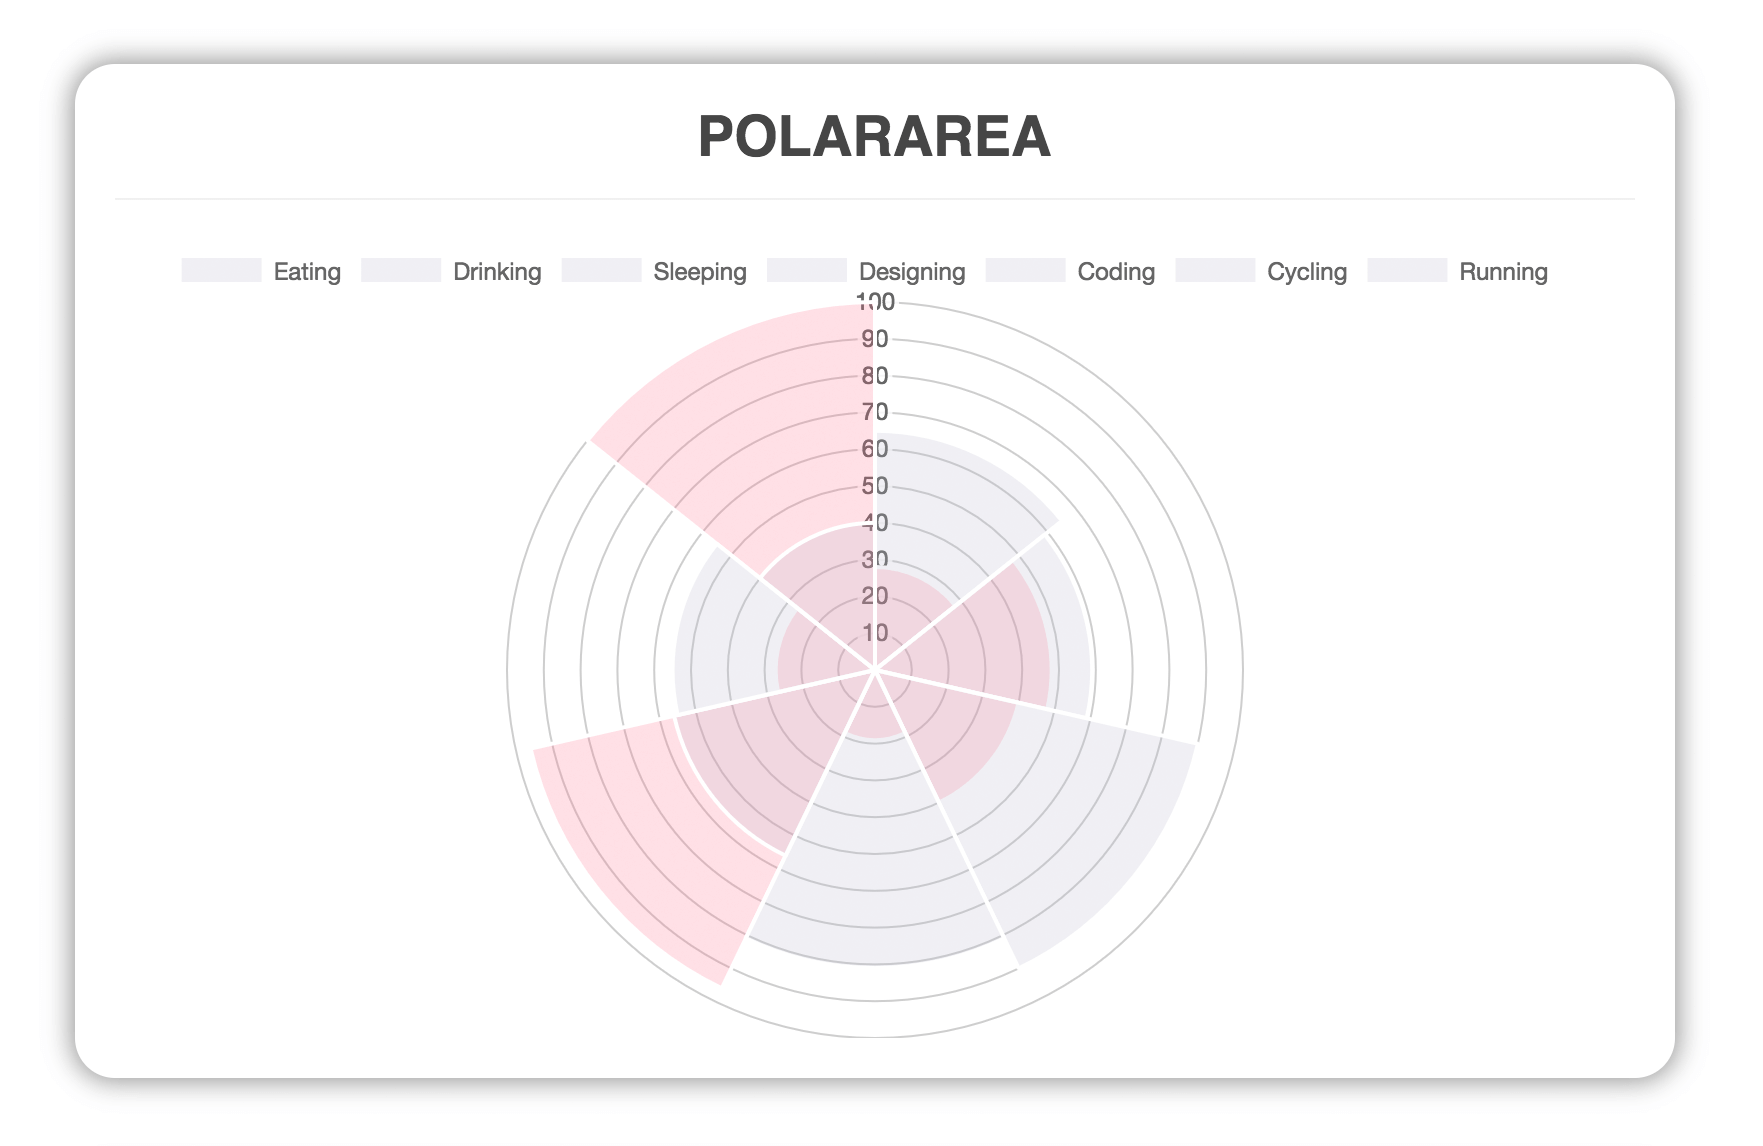
### Polar Area
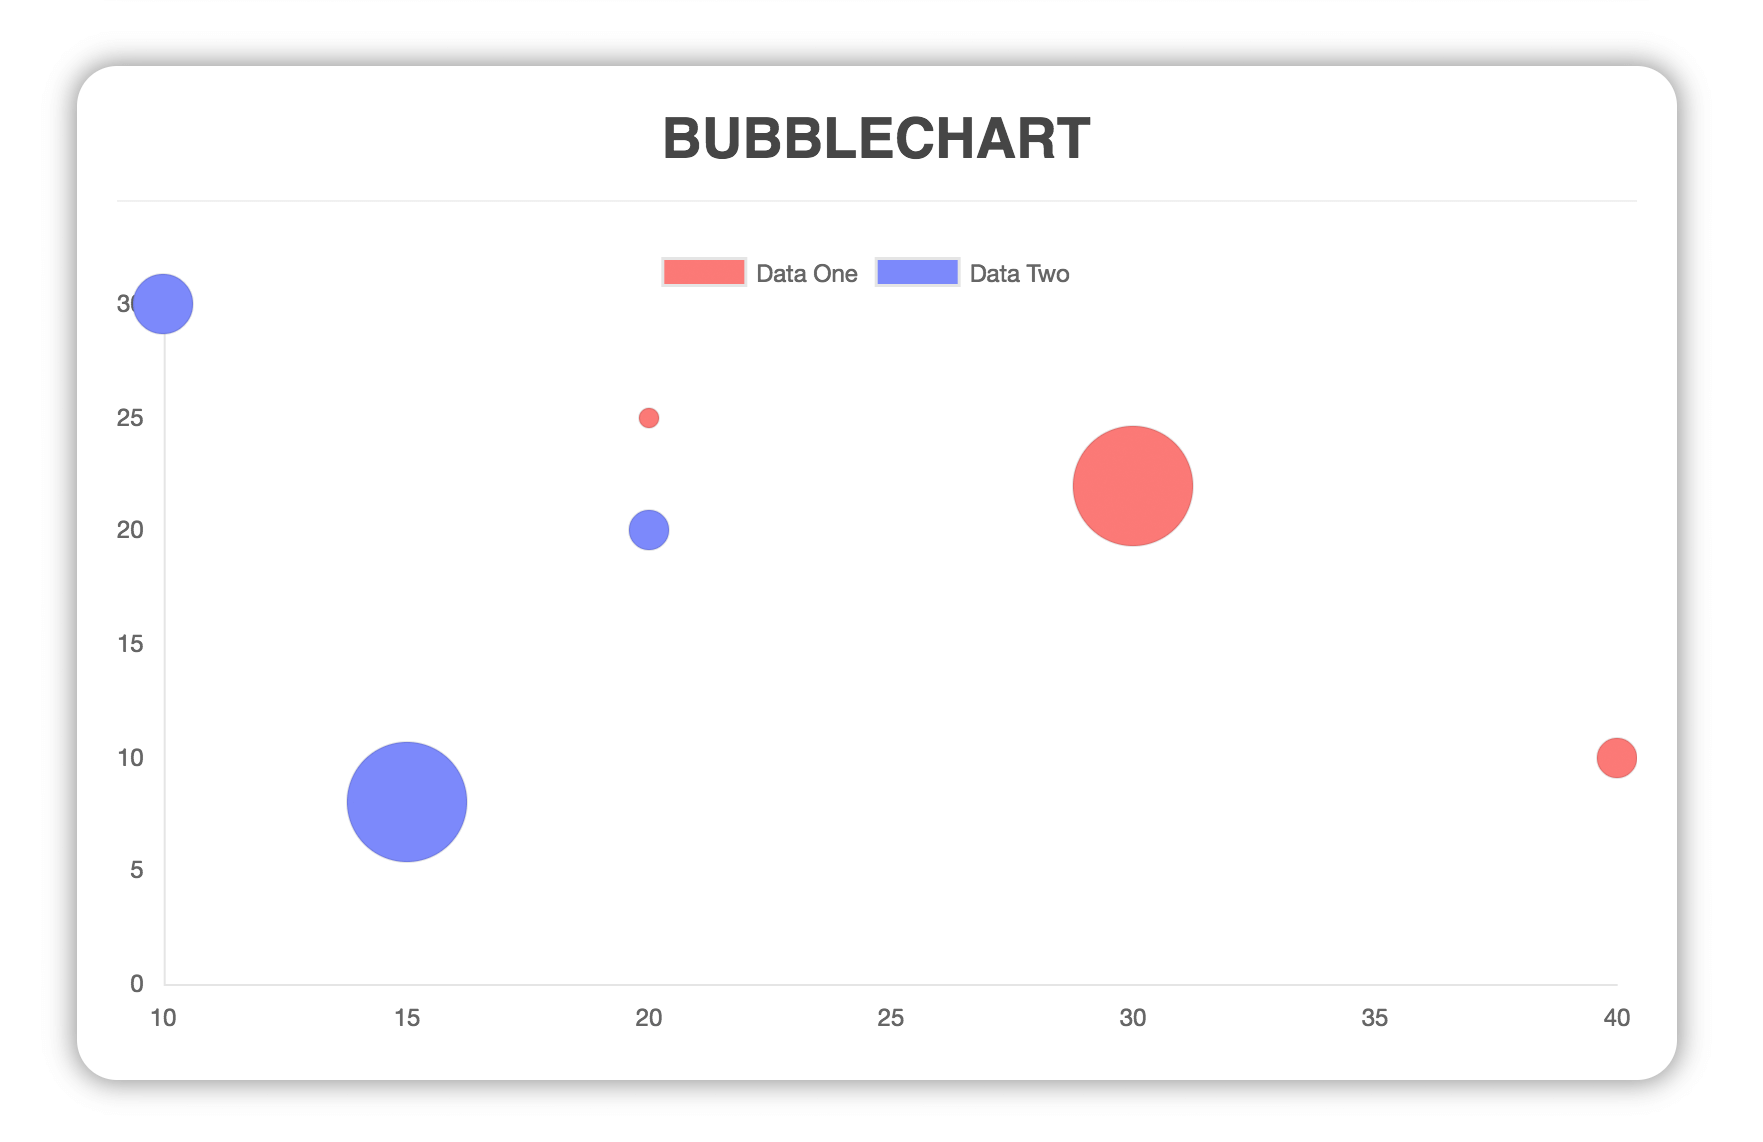
### Bubble
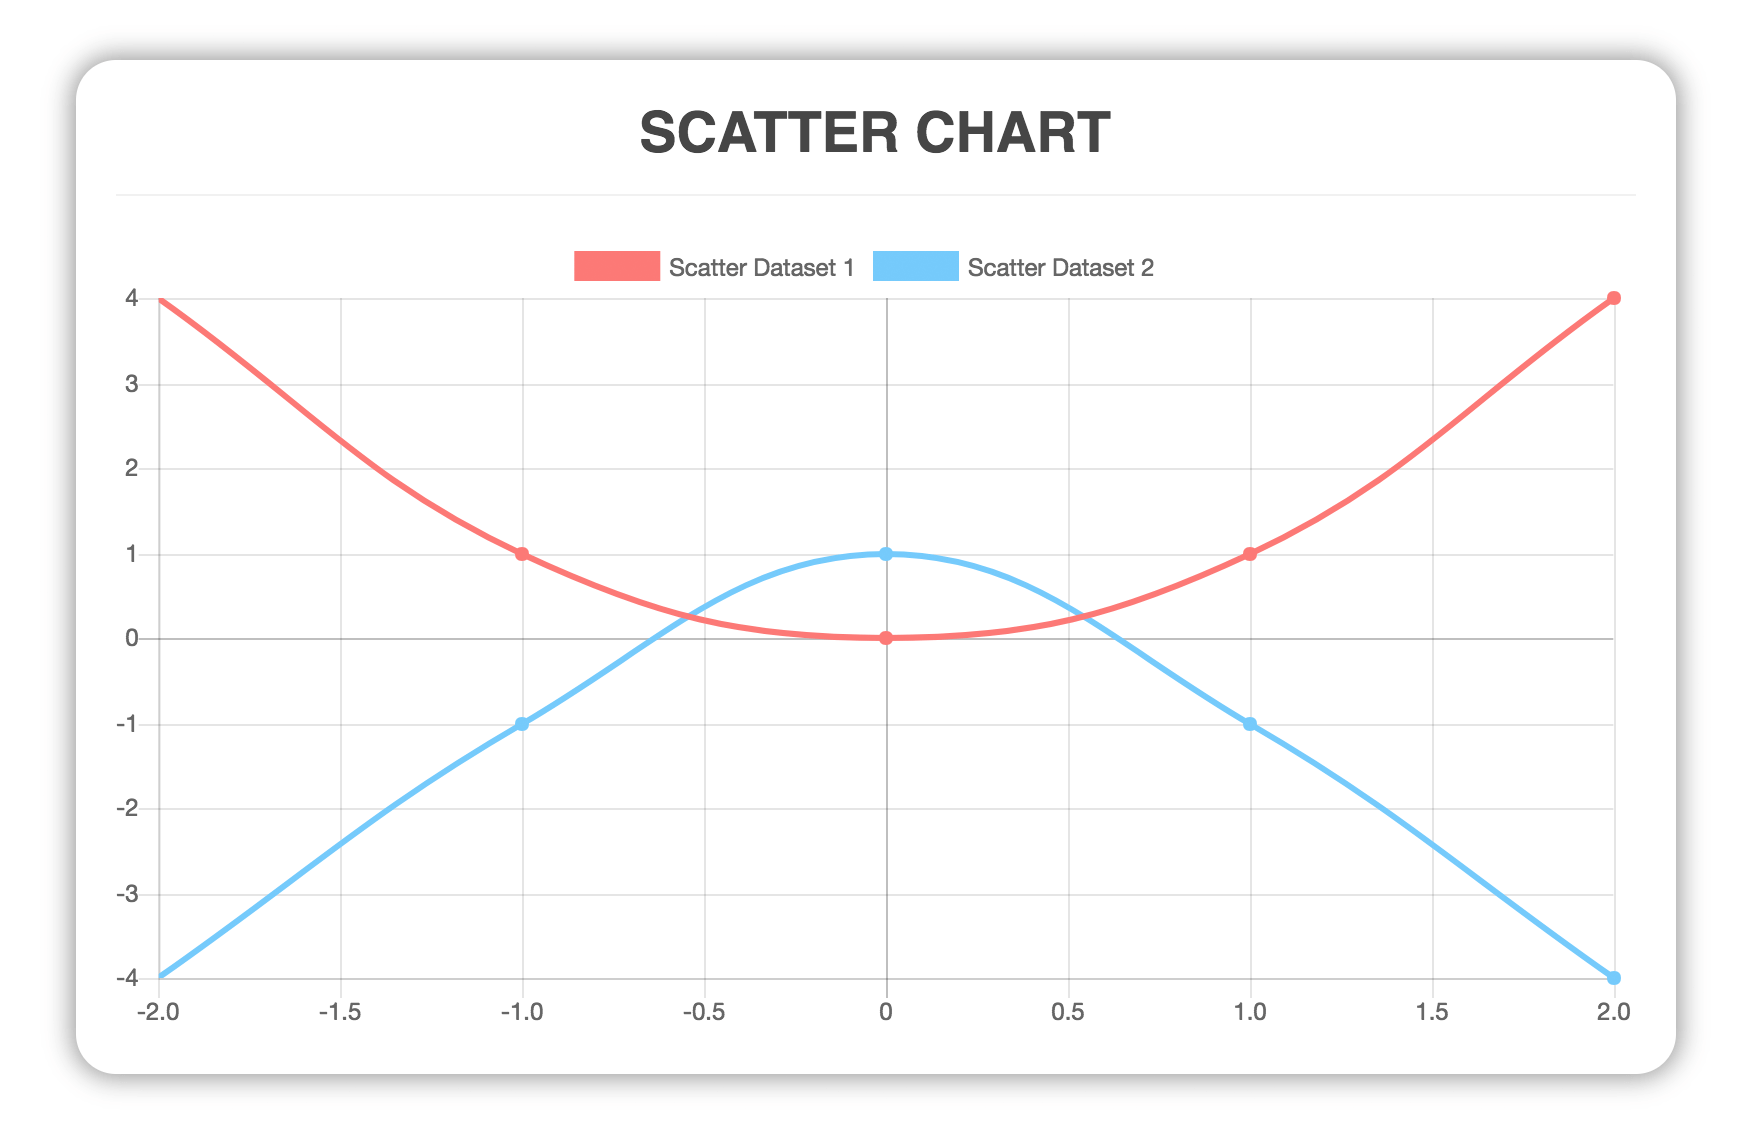
### Scatter
## Build Setup
``` bash
# install dependencies
npm install
# serve with hot reload at localhost:8080
npm run dev
# build for production with minification
npm run build
# run unit tests
npm run unit
# run e2e tests
npm run e2e
# run all tests
npm test
```
For a detailed explanation on how things work, check out the [guide](http://vuejs-templates.github.io/webpack/) and [docs for vue-loader](http://vuejs.github.io/vue-loader).
## Contributing
1. Fork it ( https://github.com/apertureless/vue-chartjs/fork )
2. Create your feature branch (`git checkout -b my-new-feature`)
3. Commit your changes (`git commit -am 'Add some feature'`)
4. Push to the branch (`git push origin my-new-feature`)
5. Create a new Pull Request
## License
This software is distributed under [MIT license](LICENSE.txt).
